Google Data Studio: Influence Business Decisions
The total amount of data in the world is expected to reach 44 zettabytes within the next few years. To put this in some perspective, the amount of data produced every day is equal to about 500 million songs. For many businesses, an effective way to keep track of the available data that’s actually relevant is with Google Analytics, which produces several reports on everything from where your traffic is coming from to what actions visitors are taking when on your website.
Google Data Studio is a companion resource you can use to leverage data from multiple sources in a way that’s more organized so you can make well-informed marketing decisions.
What Is Google Data Studio?
Launched in 2016 as part of Google’s Analytics 360 Suite data management platform, Data Studio is essentially an all-in-one dashboard you can use to customize and share your metrics. It has appealing features such as the ability for anyone you share it with the hoover over your metrics to view your different labels and numbers (to better understand what your data means).

Even though it hasn’t been around that long, Google has already taken steps to improve it and make it more user-friendly, most notably with:
- Search Console integration (to monitor data specific to your website’s performance)
- Added support for AdWords accounts
- The ability to view data on keyword performance specific to click-through-rates, clicks, and impressions (makes Data Studio useful for SEO purposes)
- The removal of differing currency fields in sub-account data (essentially avoids a comparison of apples to oranges to make your data easier to interpret)
- The ability to add multiple (up to 75) sub-accounts to your DS reports
Levering Data Studio Reports
If you haven’t done so already, set up Google Analytics for a single user or for multiple clients since GA will be a primary source of info for your Data Studio reports. DS allows you to select your preferred data sources so you can view the stats you’ll need to view to determine if you are on track with your key performance indicators (KPIs) for your business.
For instance, if you want to focus on your paid efforts, you can build reports based on your AdWords info. Features you can use to further leverage your metrics with Data Studio reports include:
- Drop-and-Drag: One of the most appealing features of DS is the ability to copy, paste, group, and order your data by building reports with various drag and drop components.
- Data Heat Map: A color-coded display of various columns of data that identifies things like high-cost keywords and high cost-per-clicks (or any highs and lows in your data) in a way that’s easy to visually interpret.
- Data and Filter Controls: Allows others who view your data to compare stats within the same reports by date; also allows viewers to choose what data to view in graph or table form.
- Auto Compare: Identify notable changes within your data for specific metrics with this feature by comparing a data range with data from a previous period or year.
Adding Data from Non-Google Products
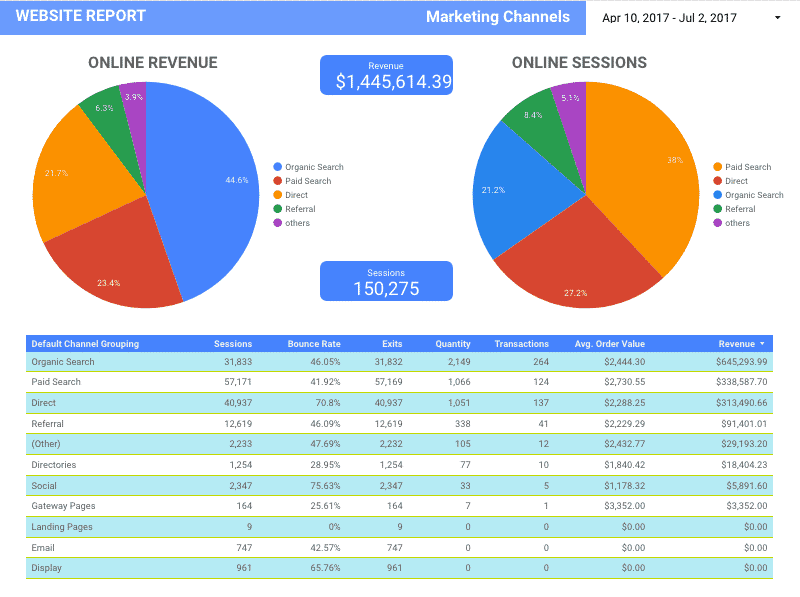
Data Studio reports can include data from non-Google sources. It’s not automatic integration (there are additional steps involved), but you can still add data from sources like Bing and Facebook (allowing the ability to track the performance of your social media marketing efforts), which comes in handy if you have a lot of Non-Google info you want to compare with your Google data.
Developing a Data Studio Strategy
No metrics are going to be meaningful to you if you don’t have a clear strategy in place, and this is certainly true when it comes to Data Studio. Plus, DS may not even be right for your reporting needs. Before you explore the possibilities with your Data Studio reports, I’d recommend taking the following step:
1. Know What You Want to Track and Why
You’re not going to be able to make business decisions with your Data Studio reports if you’re not sure what it is you to want to track and why you’re doing so. Clarify the goals and objectives you have for your website and your various forms of online engagements before you do anything else.
2. Determine If Data Studio Is Right for Your Needs
Data Studio has many appealing uses (and Google is still tinkering with it, so odds are good additional capabilities will be added in the near future). However, it’s only a useful resource if it’s right for your needs. If you only need access to very basic data, for instance, Google Analytics alone may be fine for you.
DS may not work well if you have a lot of complex data (e.g., tables, graphs, detailed data collections where it’s more difficult for an automated report generator to pull data) that can’t be easily condensed into neat visualizations in report form (DS doesn’t replace Google Sheets or Excel). It can also have limitations if you use several different data sources for reporting. Generally, Data Studio is recommended if you have needs involving:
- Several individuals on your marketing team who regularly report on campaign performance or need to access such data
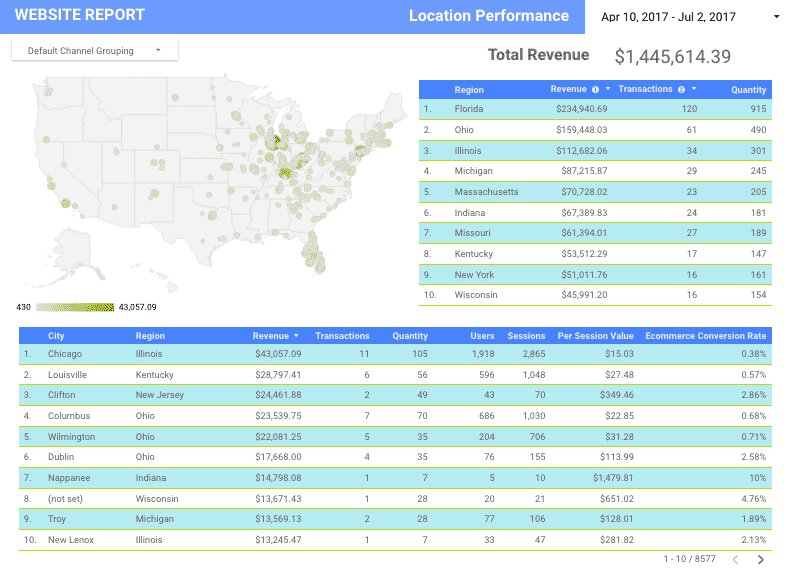
- A need to access individual and aggregate reports from multiple locations and regions
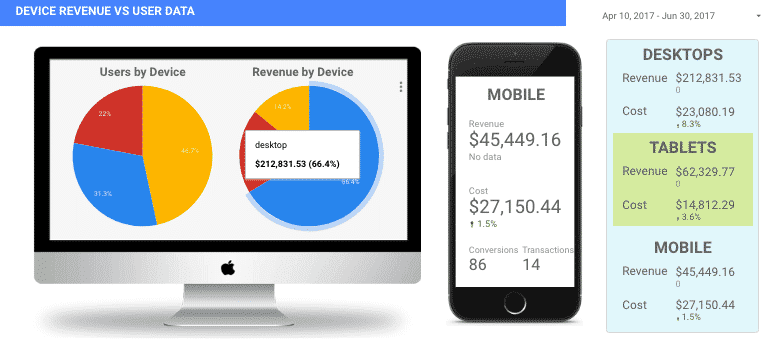
- Multiple campaigns across multiple platforms with various third-party vendors whose data you want to evaluate without the need to constantly check your AdWords and Google Analytics stats
- A desire to have more flexibility with how your data is presented
- The ability to share insights and thoughts throughout your data for others on your team to view when checking the same data
3. Identify Your Data Sources
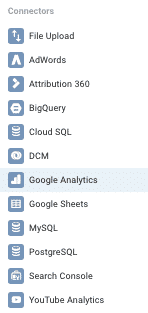
Choose your Data Studio connectors next. You’ll be able to bring in data from any of the various Google products you may be using for data collection purposes, including AdWords, Google Analytics, MySQL and Cloud SQL, File Upload, Search Console, YouTube Analytics, and Google Sheets. As mentioned previously, you can also import data from non-Google sources and connect various databases to enhance your pool of data sources.
4. Decide How You Want Your Data Presented
Explore Data Source templates and report samples to get an idea of how you want your data presented. You can even draw an outline on paper or use MS Paint’s draw tools to figure out how you want your reports to look. Find templates that closely match your doodles or explore customization features to create layouts you like.
5. Build Your Reports
After you know what kind of data you want to see and what data sources you wish to use, it’s time to build your reports! Data Source is unique in that you can add notes and analysis within your reports to clarify your stats or identify info you want to reference later (kind of like digital Post-It notes). You can further customize your reports by:
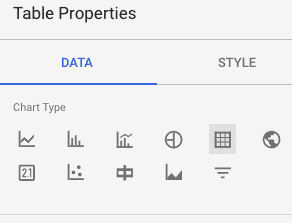
- Choosing chart and graph formats that best visualize your data
- Adding brand images and logos
- Customizing fonts and colors
- Generating reports from specific data sources, adding new sources, or excluding data sources you no longer find meaningful
Google Data Studio is fairly easy to use and customize, especially since updates were made. Streamlining your data with automated Data Studio reports takes some of the uncertainty out of the marketing decisions you have to make to maintain your revenue flow and brand visibility.
As you get a feel for what data you need to see on a regular basis, you’ll also be able to determine how to manage your organic and paid online marketing efforts more efficiently. Doing so often means a better return on your investment and more time to focus on running your business and distributing relevant content to the right audience — which can also have a positive impact on the results you’ll see reflected in your data.
How useful is the data you’re getting now? Do you think you could better achieve your business goals if you leveraged your data more effectively? Leave a comment and share your thoughts!
